IT
IT  EN
EN 
 The United States has both the largest number of millionaires and the largest number of poor people in the developed world. This paradox of extremely high individual wealth, and also high aggregate wealth, along side of millions of poor individuals and thousands of depressed neighbor- hoods, cities and regions was recently exposed by the devastating hurricane Katrina and its aftermath. Like race, poverty is a topic few national leaders (of either party) wish to discuss. Over 40 years after Michael Harrington’s classic, The Other America the poor are still mostly invisible and ignored. The purpose of this article is to look at why poverty remains stubbornly high in the USA, concentrating on the economic “causes” or explanations of poverty. We should be clear from the outset that our approach will be solely economic, viewing poverty as an economic phenomenon. This approach is, in many ways, overly narrow and simplistic, as poverty is a social phenomenon which is as much social, political, and cultural as it is economic, both in its causes and its effects. In the end, all useful explanations of poverty will need to include all these aspects of poverty. Our justification for taking such a narrow perspective comes from the hope that concentrating on one of the multitude of causes and effects of poverty will hopefully give us greater insight into the economics of material poverty. We also offer a modest proposal for lifting all Ame- ricans above the poverty line.
Defining Poverty
At the start of any investigation of poverty is the question: what is poverty? That is, we need to first define and measure poverty. Generally, one is poor if one's income, or the income of the family or household income one lives in, falls below a “poverty threshold.” There are two basic ways of constructing a “poverty threshold,” based on two ways of conceptualizing poverty: poverty is absolute or poverty is relative. The absolute conception of poverty attempts to set a level of income or consumption necessary to meet basic needs. Often this is done through the construction of a standard budget (adjusted for different family sizes) which it is determined reflects the minimum necessary for an adequate standard of living. Such budgets are usually based on the cost of food and other basic goods. All who live in households with incomes below this level are defined as poor. The relative income approach, while remaining in the general materialist conception of poverty, takes a broader view of poverty, going beyond merely feeding, housing and providing clothes. Generally it defines poverty based on some relation to the median or mean income of that society. Underlying these two approaches are different philosophies, for want of a better term, toward the poor.1 The standard budget approach is based on a “standard of living” view, which seeks to have all in society meet a minimum material existence standard, that is, sufficient food, clothing and shelter. The relative approach follows a “minimum rights” view, which takes the position that “people are seen as entitled to a minimum income, which is a prerequisite for participation in a particular society. It may be linked to citizenship, in terms that a certain minimum level of resources is necessary in order that people may enjoy effective freedom”.2
The main difference between the two approaches comes out in how they are adjusted over time. The standard budget approach makes a judg- ment as to what is the minimum necessary level of income and then it updates the poverty threshold each year to account for inflation, linked either to the general price level or to the prices of the goods that make-up the bundle of consumption goods that are included in the standard budget. Relative poverty thresholds are adjusted along with changes in either the mean or median levels of income or consumption.
The main weakness of the standard budget method comes from its assumption that the com- position of goods the poor consume remains the same, with only prices changing. Yet the level of minimum necessary consumption is socially and historically specific, different today from what it was 20 or 50 years ago. The historical evidence shows that poverty lines based on the standard budget method updated to changes in consumption patterns and recalculated, and not just adjusted to changes in the price level, rise at a rate faster than the price level. If the standard budget method is not updated for changes in the composition of goods in the standard budget, as well as changes in prices, it will, when used over an extended time period, result in too low a poverty threshold and thus an undercounting of the poor.
One attempt at reconciling the two theo- retical approaches at defining and measuring poverty is the capabilities approach of Nobel Prize winning economist Amartya Sen, who argues that money or commodities do not provide for an individual's well-being, but instead they provide capabilities. “At the risk of oversimplification”, Sen writes, “I would like to say that poverty is an absolute notion in the space of capabilities but very often it will take a relative form in the space of commodities or characteristics”.3 An example might help to illustrate this point. The human capital, skills and education necessary to participate in the economy of 50 or 100 years ago was fairly limited and is much less than what is required today. This is the case even if we keep the income class of the worker constant. What is important in both cases is for the person to have the capabilities to participate fully in a given society (a strong back and work ethic in the 19th century, years of education and computer skills today). How these capabilities are met will change from society to society, and from year to year. Thus there is an absolute need for capabilities to allow for participation, yet how these capabilities are provided will differ based on historical and social context (they are relative).
Relative Poverty in America
Most countries use relative measures of poverty, defining it as 40%, 50% or 60% of some average income measure (median household in- come, median real wages, etc). While the official poverty rate (to be discussed below) in the USA is based on an objective measure of poverty, using a relative measure allows for comparisons with other similar countries. That is, we can see if the USA is more or less successful in combating poverty.
Table 1
Poverty Rates of Various OECD Countries
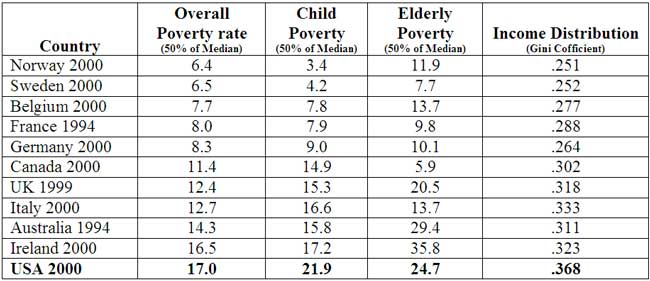
Source: LIS.
From Table 1 we see that poverty rates differ significantly within this small group of countries at a similar level of economic devel-opment. Australia, Ireland and the USA have poverty rates more than double those of Sweden and Norway. Moreover, the variance for Child Poverty rates is even more pronounced, with the USA Child Poverty Rate being five times that of Sweden and Norway. Interestingly, while Overall and Child Poverty rates mostly have a similar ranking, Elderly poverty rates do not (the UK, which has the 7th lowest Overall Poverty rate has the lowest Elderly Poverty rate).
Table 1 also shows one of the often mentioned limitations of relative poverty measures, the correlation between poverty rates and measured income inequality. Countries with great inequality could have high relative poverty rates simply because incomes are spread out further from the median than a country with low levels of inequality. This objection is based on the assumption that pov- erty and inequality need to be kept separate (thus a measure that captures the effects of one should somehow be invalidated for the other). The major problem with correlation analysis is that a corre- lation does not imply causation. Whether one argues that inequality causes poverty or that poverty causes inequality (the existence of poor people will spread out the income distribution) is based mostly on the overall methodology adopted by the theorist. If one follows the dictates of methodological individual- ism, then one will argue that individual factors generate poverty and that this leads to income inequality.
If, instead, one follows methodological holism then one will look to structural factors to explain poverty as an outcome, thus, inequality generates poverty.
Official Poverty in America
The official measure of poverty in the USA is based on the absolute poverty approach. Ori- ginally developed by Mollie Orshansky for the Social Security Administration in 1963-64, the “official” poverty threshold for the United States is based on the consumption patterns of the early 1960s (and the eating habits of the 1920s) and adjusted, since 1969, to changes in the Consumer Price Index. Numerous government and academic reports (and an episode of the television show The West Wing) have demonstrated the serious flaws in this approach over time. All will agree that consumption patterns have changed significantly in the past 40 years. As Gordon Fisher has written “the only kind of American society in which it would be socio- logically justified to have had the same fixed, constant - dollar poverty line since the mid -1960s would be a society in which there has been essen- tially no technological changes and innovations since 1960. In a society in which there had been extensive technological changes and innovations since 1960, the appropriate course would be to have a poverty line which is higher than the poverty line developed in the 1960s and which does rise in real terms over time in response to increases in the general standard of living”.4
Source: US Census.
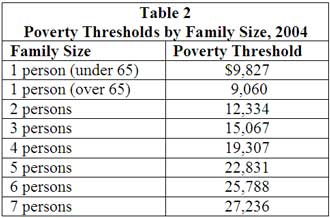
In Table 2 we see the poverty thresholds by family size for 2004. Here we see another problem with the official poverty line in the USA, for $19,307 (poverty threshold for family of 4) goes much further in some areas of the country than it does in others. In a country as big and diverse as the USA it makes sense to have a measure of poverty that accounts for differences in the cost of living between areas, and not just in differences between time periods.
Graph 1 tracks changes in the official poverty rate from 1959 to 2004. The graph shows that after initial success in the 1960s, the poverty rate has fluctuated between 11% and 15%.
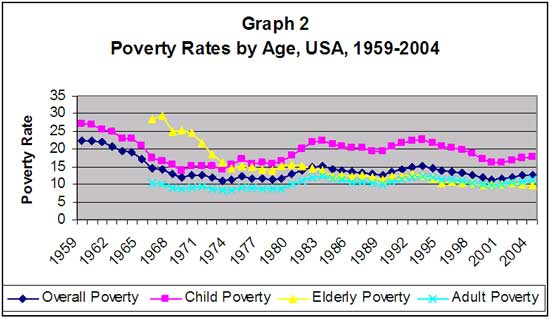
Graph 2 presents the poverty rates for different age groups. Here we see that the poverty rate for the Elderly continues to fall, even though it is at a snail’s pace, yet the poverty rate for Adults (working age population) has been inching upward, and the Child poverty rate remains significantly higher than either the Adult or Elderly rates. This graph indicates that anti-poverty efforts in the US for the Elderly (Social Security) have been more effective than policies for Children and Adults.
Economic Causes of Poverty
Scarcity
The primary policy for reducing or elimi- nating poverty in America has been to promote economic growth.5 The basic idea has been to try to make the economic pie larger so that all can have more, rather than to slice the current pie up more equally. The political benefits of this policy are twofold: 1) it avoids the conflicts over shares and thus avoids the specter of “class warfare” ; 2) the promoting of economic growth benefits the affluent and business, the two groups with the most political power. The economic rationale behind this policy is the long – held belief that poverty is caused by scarcity (not enough to go around), that redis- tribution will cause inefficiencies (the equity/ efficiency trade-off), leaving less for all, and that the market ensures that economic growth will cause a “rising tide that will lift all boats” (the trickle down effect). While the political reasons for promoting economic growth as a means to reducing poverty still exist, the economic rationale has in- creasingly come under suspicion. The past thirty years of economic growth in the United States has not had much success in significantly reducing poverty, either in its depth or its scope. If insanity is doing the same thing and expecting different outcomes, it might be considered insane to continue to look to economic growth as our primary poverty reducing policy.
One of the most consistent aspects of America’s dynamic and constantly changing econ- omy and society over the past three decades has been the persistence of high poverty rates. From 1973 to 200, real GDP grew by 149% and real per capita GDP grew by 82%, while the official poverty rate experienced no real improvement - going from its all time low of 11.1% in 1973 to 11.7% in 2001 (with 2000’s 11.3% being the lowest level since 1973). For most of this time, as we see in Graph 1, the poverty rate fluctuated between 12% and 15%, showing no long run trend downward (while there is a clear trend upward in GDP). This is in stark contrast to the period of 1959 to 1973 when real GDP grew by 78% and per capita GDP grew by 49% and the official poverty rate declined in a steady fashion (with some expected increases due to recession) from 22% to 11.1%.
The effect of economic growth on poverty rates can be seen in Table 3, which looks at the relationship between changes in GDP and poverty rates over the business cycle since 1960.

Parentheses indicate t-statistic.
The coefficient for GDP growth indicates the impact of economic growth on the poverty rate. We can see that the coefficient for GDP growth declined significantly in the 1973 business cycle and again in the 1981-1991 business cycle. The slight increase in the 1991-2001 business cycle is still one third of the 1969-1973 level.
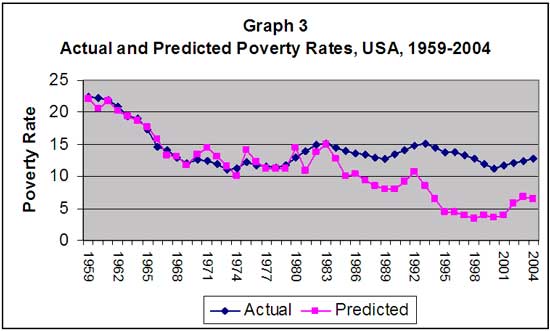
It is clear that economic growth’s ability to reduce poverty has been greatly weakened since the early 1980s.6 Using a model based on the work of Rebecca Blank, we have estimated the effects that various macro economic variables have had on poverty rates in the United States from 1959 to 1981 and carried forward these variables up to 2004 to see how they influenced poverty rates in the 1980s and 1990s. While the Blankesque model is very accurate for the earlier time period, we see that current poverty rates are much higher than those predicted by the model.
Had the relationships of the 1960s and 1970s held, we would have expected a significant drop in poverty rates to historic lows, falling below 4% in 2000.
Income Inequality
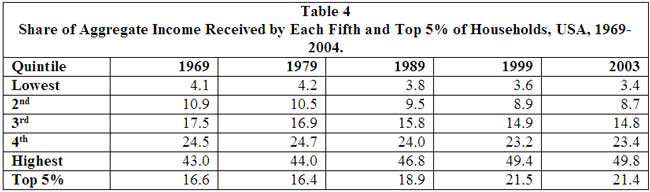
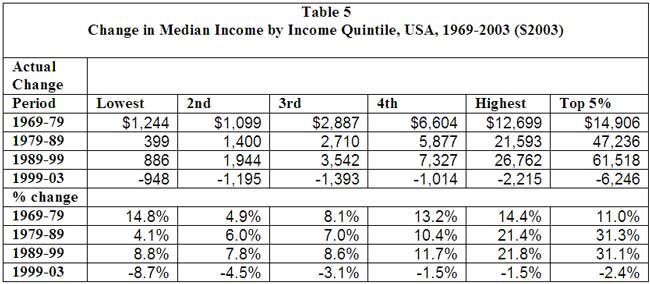
One of the reasons that economic growth has not successfully reduced the poverty rate in the USA is the fact that most of the benefits of economic growth have gone to the already well-off. As we see in Tables 4 and 5 below, not only has the share of aggregate income going to the top 20% gone up, from 43.0% in 1969 to 49.8% in 2003 (it reached 50.1% in 2004) and thus the shares going to the bottom 80% have fallen, the rate of increase for the poor, near poor and middle class lagged well behind the rate of increase for the rich.
Source: U.S. Census, CPS.
Source: U.S. Census, CPS
Furthermore, the negative effects of the 2000 - 2001 recession have hit the poor consider- ably more (8.7% reduction in real income) than the affluent (1.5% decline).
Real Wages
The standard means by which economic growth is translated into rising living standards is through a rise in real wages. Generally, when prod- uctivity increases, meaning workers are, on average, more productive, most of the benefits of this productivity is passed on to the workers in the form of higher wages. Since the mid 1970s, however, this has not been the case.

Demographic Factors
It is common to explain the persistence of poverty by looking at the characteristics of the poor, especially race, gender and level of education. The standard economic approach to demographic factors is to look at each factor as if it had a market determined price. The analysis attempts to explain a poor persons low income starting from the low price they receive for their human capital (this might make sense for education, but it is a bit absurd for race and gender).
Race
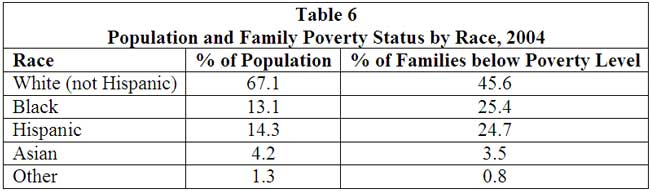
There is no escaping the conclusion that race plays a role in the determination of poverty rates in America. In Table 6 we see that while Blacks and Hispanics make up 13.1% and 14.3% respectively, of all families in the USA, Blacks make up 25.4% and Hispanics 24.7% of families below the poverty level.
Source: US Census.
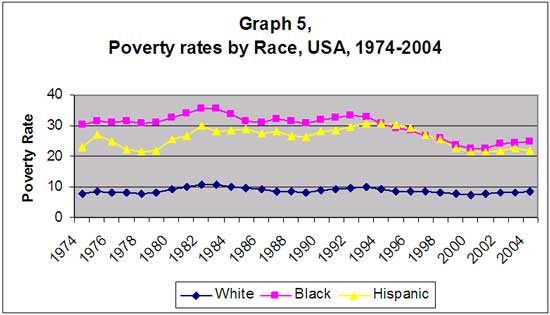
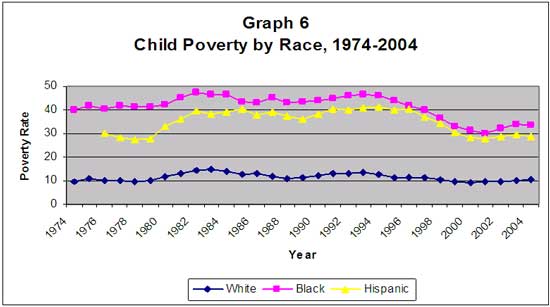
And while the gap between the incidences of poverty for Blacks has fallen from over four times the rate for Whites in 1973 to 2.9 times in 2004, poverty rates for Blacks and Hispanics have remained stubbornly higher than those Whites. Looking at poverty rates by race we see a similar story of persistent poverty, with the notable exception of the poverty rate for Blacks recently falling below the early 1970s previous low. As we see in Graph 5, White and Hispanic poverty rates have not been able to break the floor set in the 1970s. When we divide the poor by race and age, again we find few examples of the economic prosperity of the post-1973 period having a substantial impact on poverty. So far it seems as if only Blacks (Children, Elderly and Adults) and White Elderly have been able to reach poverty le- vels below their previous lows in the early 1970s, with the rate of White Children falls just below its 1974 low in 2000.
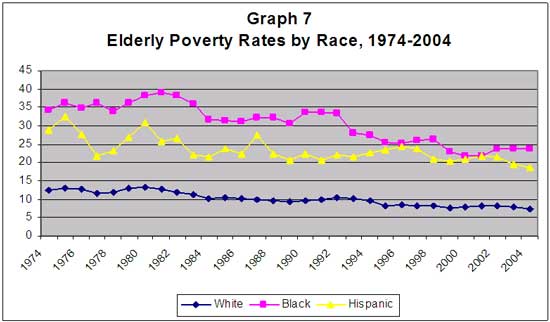
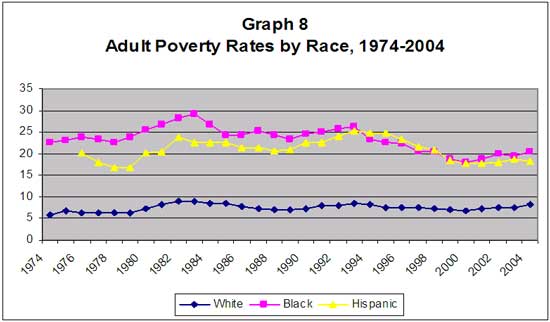
For each cohort there is a significant gap between the White poverty rates and the Black and Hispanic rates. It is hard to determine how much of this gap is due to the past effects of discrimination and how much is due to current discriminatory practices. The income of one’s parents is the most important predictor of one’s own income, thus high Child poverty rates for Black and Hispanics forecast high future Adult poverty rates. The reasons for this are many - ranging from better health and edu- cational opportunities to social and cultural effects of poverty. Here we see the lasting and continuing impacts of past legal discrimination. However, even though legal discrimination has been eliminated (official segregation), how the USA spends its current health and education dollars heightens the already high levels of income inequality, promoting high future rates of poverty. By giving inadequate medical care to a population, you ensure that large numbers of them will end up in poverty. They will be too sick or weak to compete successfully in any job market. Furthermore, an inadequate education is often a certain road to poverty, as we see in Table 7.

Source: Mishel, Berstein and Boushey, 2003, p. 336
Family Structure
Family structure is an important factor in explaining poverty in the USA. Living in a family reduces the chance of living in poverty. In 2004, 11% of families lived at or below the poverty level, compared with 20.5% for those living alone or with unrelated individuals. The support that comes from families is clearly important. The type of family structure is also significant. 48.3% of all poor families are Female Headed Households with no husband present. Furthermore, Female Headed Households have a 30.5% poverty rate, triple the rate for all families. Only 5.7% of Male Headed Households fall below the poverty rate.
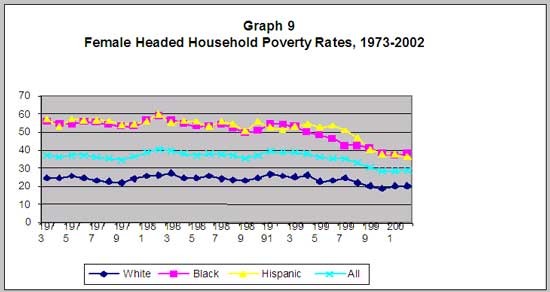
The above table shows that while the poverty rate of White Female Headed Households has been fairly stable, the poverty rates for Black and Hispanic Female Headed Households has declined in the past decade, another small success story in US efforts to reduce poverty (due mostly to employment gains by this cohort).
Ending Material Poverty
As we have seen above, efforts to end material poverty which rely mostly on economic growth are not likely to be successful. Economic growth is rarely robust enough to trickle down to the poor, and since the 1970s economic growth has never lasted long enough to have a lasting effect on the level of poverty in America. Eliminating legal discrimination has helped reduce the incidence of poverty among Blacks, yet the benefits of these efforts (and affirmative action programs) seem to have reached their limit. The lower number of Blacks and Hispanics in high paying occupations is not due to discrimination in employment practices for the most part (in fact the opposite is often true). The problem is the scarcity of qualified minority applicants. Poverty has to be defeated before one reaches adulthood if we are to have widespread reductions in the number of poor in the USA. Breaking the cycle of poverty requires that first, we eliminate material poverty so that no child grows up hungry and in need. While this will not finish the job, as more assistance will be needed to break the culture of poverty, it is a necessary first step, and it could be done through redistribution. The most effective way to eliminate material poverty would be the institution of a guaranteed minimum income for all as a right of citizenship.
A Basic Income for America
Poverty is caused by the exclusion of some from the right to claim an adequate share of the social product. Based on how the rules of economic participation have been structured, some cannot successfully get sufficient income to meet a decent standard of living. One way to address this inadequate income is to change the rules slightly to provide for a decent minimum income for all. I say slightly, for it is a much smaller change than what would be needed to make the necessary structural changes required to create a market system that generated a zero poverty outcome.
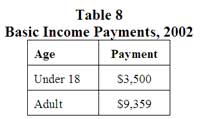
The following is a Basic Income proposal for the United States, based on the year 2002. The proposed Basic Income System here is a full one for children and adults, with a system of top-up payments for the elderly to bring all, elderly above the poverty line. The Basic Income payments have been set at the official poverty threshold for an individual (and an estimate for a child) for the year 2002. The system of top-up payments for the poor elderly is designed to get them above the poverty threshold.7 Thus, if enacted, the Basic Income System would bring the official poverty rate in the United States to zero for all population groups. The Basic Income System would have payment levels, as follows (Table 8):
This would have the following costs:
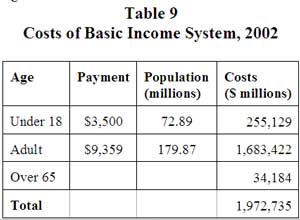
The total costs of our Basic Income pro- posal would be just under 2 trillion dollars (Table 9). Add to this the cost of the other functions of the Federal Government, which in 2002 totaled $1,743 Billion ($2,010,975 million minus the $267,322 million income security funds to be cut under a basic income proposal).8 Thus the total costs of the Federal Government would be $3,716.39 million.
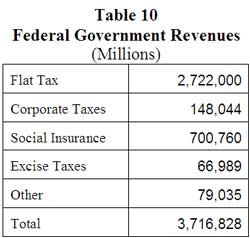
Funding for the Basic Income System, as well as for the Federal Government in general, would be through a flat tax on all incomes, to replace the Federal Income Tax, as well as the other remaining sources of Federal Government Funding. However, this proposal produces a balance budget. The necessary flat tax to fund the Basic Income System and the rest of the Federal Government would be 35.2% (32.2% if we had allowed for the deficit that actually existed in 2002). There would be no income tax deductions. State and local tax and benefits systems in our example are left untouched, although obviously they would change dramatically (i.e., be reduced or eliminated, leading to reductions in local and state taxes).
Thus, under this proposal the total expenditures of the Federal Government would be $3,716.4 billion, while the total revenue would be $3,716.8 billion, leaving a small surplus of $400 million.
Distributional Impact
Using the 2002 consumer expenditure survey data, I have simulated how such a policy would effect the distribution of income in the United States. Table 11 presents the results of this simulation. In Table 12 we see the average house- hold income for each household quintile, and their gain or loss due to the Basic Income System.
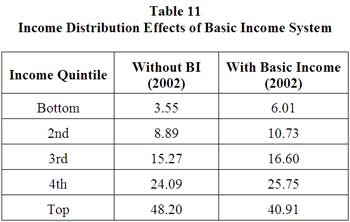
Source: Author’s calculations. Totals may not equal 100% due to rounding.
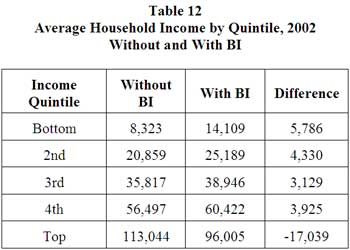
Introducing a Basic Income System in the United States like the one proposed would have the dual effect of lifting everyone above the “official” poverty level, and of more than eliminating the rise in income inequality of the past three decades.
Conclusion
In an affluent society people are poor because they do not possess a right to a share of social output that is sufficient to lift them out of poverty. It is not that they do not create sufficient output or do not contribute sufficiently to the economy or society, both of which may be true in some cases. Contribution to social output is not a necessary condition for having a sufficient share in social output. Many individuals (such as those involved in home care of children or sick and elderly) contribute greatly to the economy and society but they are granted no rights to social output for these necessary contributions, while there are many who have the rights to a large share of social output but who contribute little (or nothing to social output or not in proportion to their share). All those who live on inherited wealth fit into this category. Furthermore, it is important to re- member that the output of an economy is not the mere addition of all individual outputs, for as individuals we produce very little (if anything). All production is social production; it is carried out by people working with others in their existing communities, and working with those who have gone before us and who have passed on the knowledge, technology, culture and social institutions that make production possible. All of this greatly influences the level of output. Thus the old adage is more true now than at any time in human history: as individuals we are poor, as a society we are rich. However, who is rich in our particular society is determined by individual claims to a share in social output. It is these claims that we want to look at.
Children and the elderly, on average (and with growing numbers of exceptions) do not actively contribute to the market economy. They are too young or they are too old. Yet the reason the elderly as a group have a much lower poverty rate than childrenis because of their rights to a share in social output, most importantly because of social security. If we removed social security, elderly poverty rates would have been 47% in 1997, according to a report of the Center for Budget and Policy Priorities.9 Child poverty rates were consistently lower than elderly rates until 1974. The poverty rates of these two groups are not determined by success in the marketplace. Children are poor largely because of the economic status of their parents, much like the poverty of the elderly used to be mostly determined by the economic status of the children of the elderly (this was their safety net before the Welfare State). Social Security as a means to provide for the elderly was a response to a market failure, that is, the normal market mechanisms did not provide adequately for the material well being of the elderly since the traditional method, which worked well in an agricultural society, no longer worked sufficiently well enough in an industrial society with a great deal of labor mobility. Thus a command solution had to be instituted.
For adults of working age, the deter- mination of their incomes (or market rewards) is also not solely (or in many cases largely) the result of market forces. Neoclassical economic theory explains income distribution with the marginal pro- ductivity theory of distribution. This argues that incomes are somehow linked to productivity, or as John Bates Clark, the originator of the theory, argued, “the distribution of the income of society is controlled by a natural law, and […] this law, if it worked without friction, would give every agent of production the amount of wealth which that agent creates”10. One of the key phrases in this sentence is “worked without friction”, which means, worked without the influence of tradition and command. Yet one could not find an example of a labor market (where wages are supposed to be determined) that is not fully embedded in tradition and command, and which could not function without being so em- bedded. The only ones who seriously argue that wage rates are determined in competitive markets are tenured economics professors, whose own wage rate determination is immune from competitive market forces. Yet, labor markets are not the only factor markets that are far from “working without friction.” The role of economic power and govern- ment regulation (command) and habits and values (tradition) are to be found everywhere in the de- termination of incomes. The marginal productivity theory of income distribution has always only been an ethical argument for the validity of market outcomes and at the same time a clever way to ignore the fact that no markets work without friction.
An international comparison of income distribution and poverty rates of advanced capitalist countries clearly shows that both income inequality and poverty rates are determined by a mixture of command, tradition and market, with those count- ries with the lowest levels of inequality and poverty being the ones that give the widest array of their citizens rights to a adequate share of the social product (using tradition, command and market mechanisms to achieve these outcomes) while the countries with the highest levels of inequality and poverty would show that tradition, command and markets are used for the benefit of the affluent, with at the exclusion of the poor. Or as John Stuart Mill stated:
[T]he Distribution of wealth ... is a matter of human institutions solely. ... [I]n the social state, in every state except total solitude, any [distribution]... can only take place by the consent of society, or rather of those who dispose of its active forces. ... The distribution of wealth, there- fore, depends on the laws and customs of society. The rules by which it is determined are what the opinions and feelings of the ruling portion of the community make them, and are very different in different ages and countries; and might be still more different, if mankind so chooses.11
Both wealth and poverty are often caused by exclusion. Wealth can be created by limiting access to society’s productive assets and giving title to it to an individual or company who can then use this property right to exclude others from using it and thus force them to pay for the right to use it. This is how much of Europe’s wealth was created at the decline of the feudal order when the lands that were used for the common good (the commons and the Church’s lands) were taken by the rich to be used for their own benefit. Thus the enclosures and the Reformation led to a large increase in inequality and poverty as well as a large increase in private wealth. This type of wealth creation is merely a redistribution of wealth, from the many to the few. A good deal of modern wealth is similarly created.12 The poor are on the other side of these exclusionary barriers that those with market and political power erect in order to grab a larger share of the social product. To end material poverty we must first change how we distribute the benefits of economic activity.
Notes:
1 Atkinson, Anthony, Poverty in Europe, Oxford, Blackwell, 1998 pp. 24-26)
2 Ibid. p, 24.
3 Sen, Amartya, “Poor, Relatively Speaking”, Oxford Economic Papers, nr 35, 1983, pp. 153-69.
4 Fisher, Gordon M. “Relative or Absolute-New Light on the Behavior of Poverty Lines over Time” GSS/SSS Newsletter, Summer, 1996, pp. 10-12.
5 We are being more than a little generous in suggesting that there has been any policy in the past two decades that was geared towards reducing poverty.
6 Blank, Rebecca M., “Why are Poverty Rates so High in the 1980s?” in Poverty and Prosperity in the USA in the Late Twentieth Century edited by Dimitri B. Papadimi- triou and Edward N. Wolff, New York, St. Martins Press, 1993, pp. 292-4.
7 Top-up payments are used for the elderly for two reasons. A full basic income for the elderly would entail an elimination of social security, and payment levels that would reduce the income of some individuals currently receiving social security payments. Not wanting to make any elderly near poor worse off, we would not eliminate the current system, instead merely adding a get-the-elderly-out-of-poverty bonus. The second reason is that one of the advantages of a basic income system, as opposed to a negative income tax, is that it does not have any of the poverty or income traps, that is, disincentives to increasing one’s “earned” income. However, as most of the elderly are not in the labor force (and those who are in the labor force are there for economic reasons and would like to leave, or are there because they enjoy what they are doing), we do not need to worry about such disincentives.
8 Programs cut are Farm income stabilization ($18.3 billion), Unemployment compensation ($53.3 billion), Housing Assistance ($33.1 billion), Food and Nutrition Assistance ($38.2 billion), Other Income Security ($98.9 billion) and Income Security for Veterans ($27.4 billion).
9 Porter, Kathryn H., Kathy Larin and Wendell Primus, Social Security and Poverty Among the Elderly, Center on Budget and Policy Priorities, 1999.
10 Clark, John Bates, The Distribution of Wealth, New York, Augustus M. Kelly, 1965 [1899].
11 Mill, John Stuart, Principles of Political Economy, New York, Augustus M. Kelly, 1987, p. 209
12 Clark, Charles M. A. “Wealth as Abundance and Scarcity: Perspectives from Catholic Social Thought and Economic Theory” in Rediscovering Abundance: Interdisciplinary Essays on Wealth, Income and their Distribution in the Catholic Social Tradition, edited by Helen Alford, Charles M. A. Clark, Steven Cortright, and Mike Naughton, South Bend, Ind, University of Notre Dame Press, 2005; Clark, Charles M. A. et al, “The Nature of Wealth” (with Helen Alford, Steve Cortright and Mike Naughton) in Rediscovering Abundance: Interdisciplinary Essays on Wealth, Income and their Distribution in the Catholic Social Tradition, edited by Helen Alford, Charles M. A. Clark, Steven Cortright, and Mike Naughton, South Bend, Ind.: University of Notre Dame Press, 2005.